Dashboard
Local web and terminal dashboards for tracking development progress across all specsmd flows
Overview
The default dashboard is a local web app for monitoring your development progress in real time. It reuses the same dashboard UI components as the VS Code extension, runs against the current workspace, and watches for changes as your project state updates.
Quick Start
npx specsmd@latest dashboardThe dashboard auto-detects your flow, starts a local web server, and watches for changes. Press Ctrl+C in the terminal to stop it.
npx specsmd@latest dashboard --no-openWeb Dashboard
npx specsmd@latest dashboard [options]The web dashboard starts on 127.0.0.1 by default and opens your browser automatically. When you click a document, story, standard, or artifact, specsmd asks your operating system to open that local file from the current workspace.
Use it when you are working outside VS Code but still want the same visual planning surface:
- See the current AI-DLC bolt/run/spec state while coding in another editor or terminal-native agent
- Review specs, units, stories, standards, and recent completions without running the slower terminal dashboard
- Keep a browser tab open as a live status board while agents update the local
memory-bank,.specs-fire, orspecsfolder - Click through to local markdown documents and artifacts from the dashboard
| Option | Default | Description |
|---|---|---|
--flow <flow> |
auto-detect | Flow to inspect: fire, aidlc, or simple |
--path <dir> |
current directory | Workspace path to analyze |
--host <host> |
127.0.0.1 |
Host for the local dashboard server |
--port <n> |
random available port | Port for the local dashboard server |
--refresh-ms <n> |
1000 |
Reserved compatibility refresh interval |
--no-open |
false |
Print the URL without opening a browser |
--no-watch |
false |
Disable live file watching |
Web Examples
# Auto-detect flow and open the browser
npx specsmd@latest dashboard

# Run without opening the browser
npx specsmd@latest dashboard --no-open

# Inspect another workspace
npx specsmd@latest dashboard --path ../my-project

# Use a fixed local port
npx specsmd@latest dashboard --port 4317
Web Dashboard Screenshots
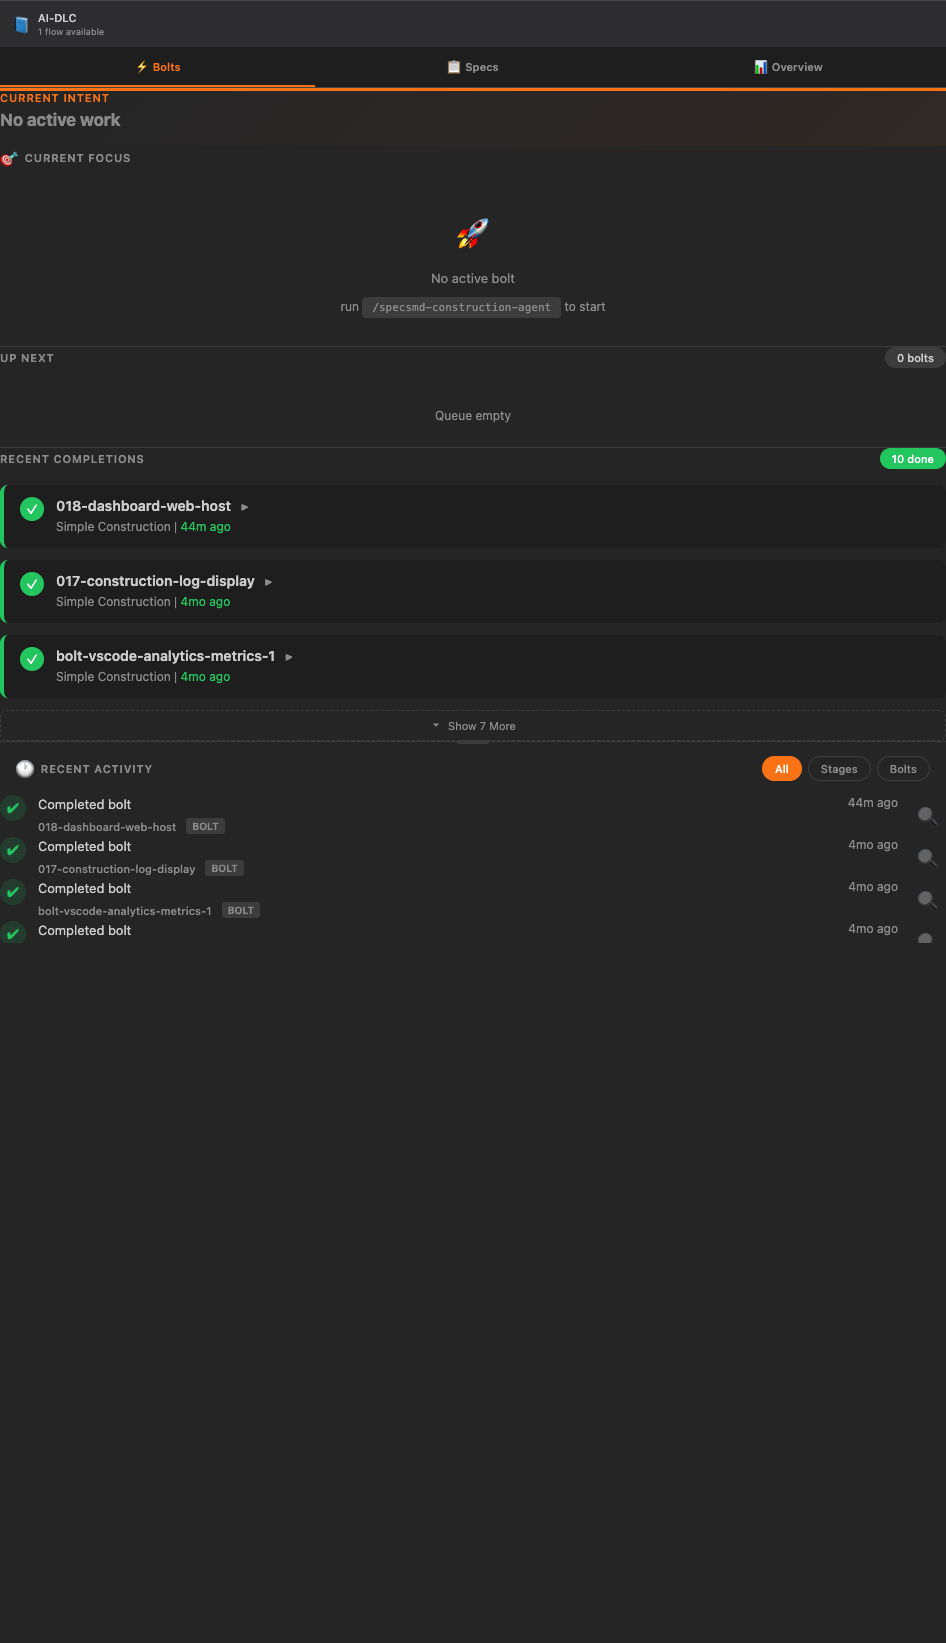
Bolts View
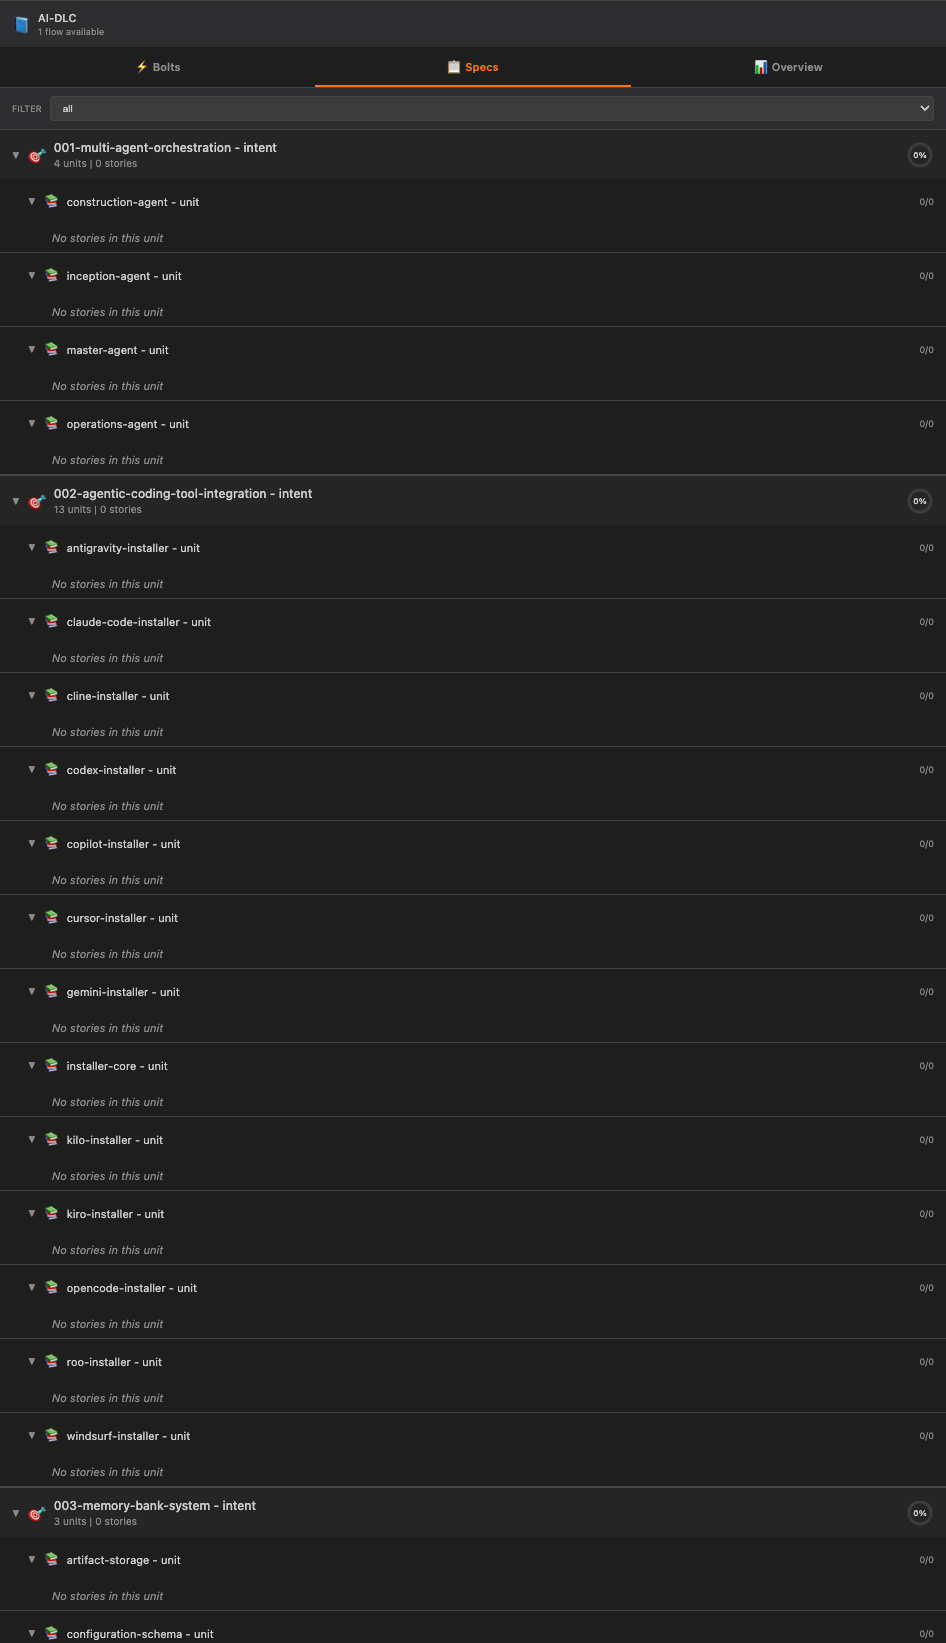
Specs View
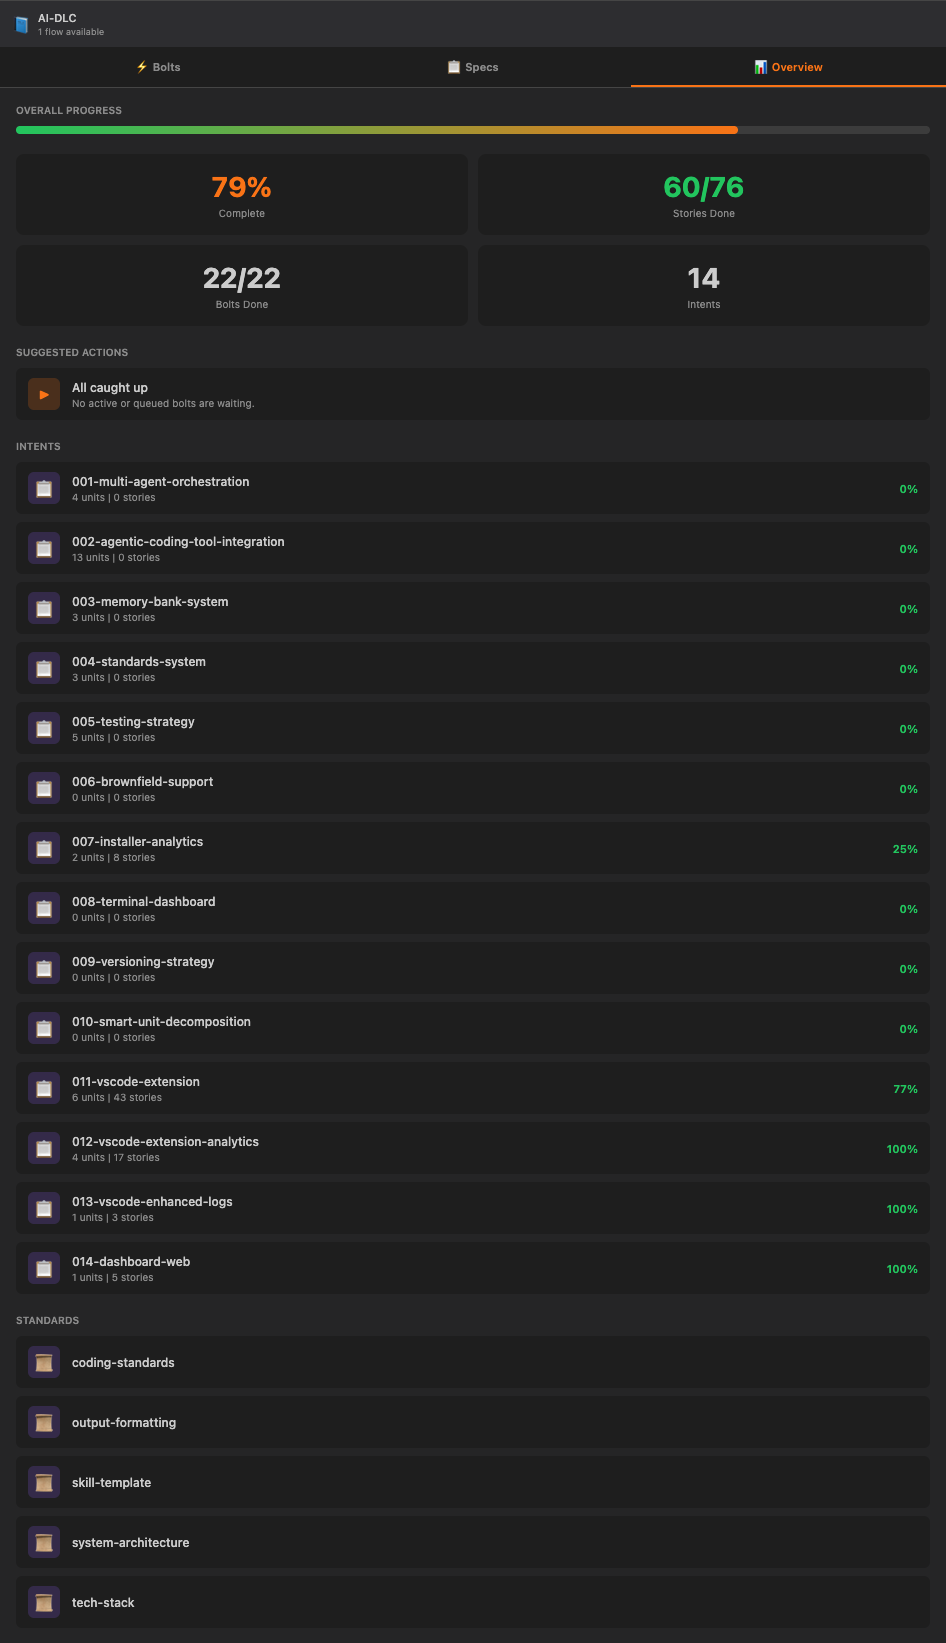
Overview View
Terminal Dashboard
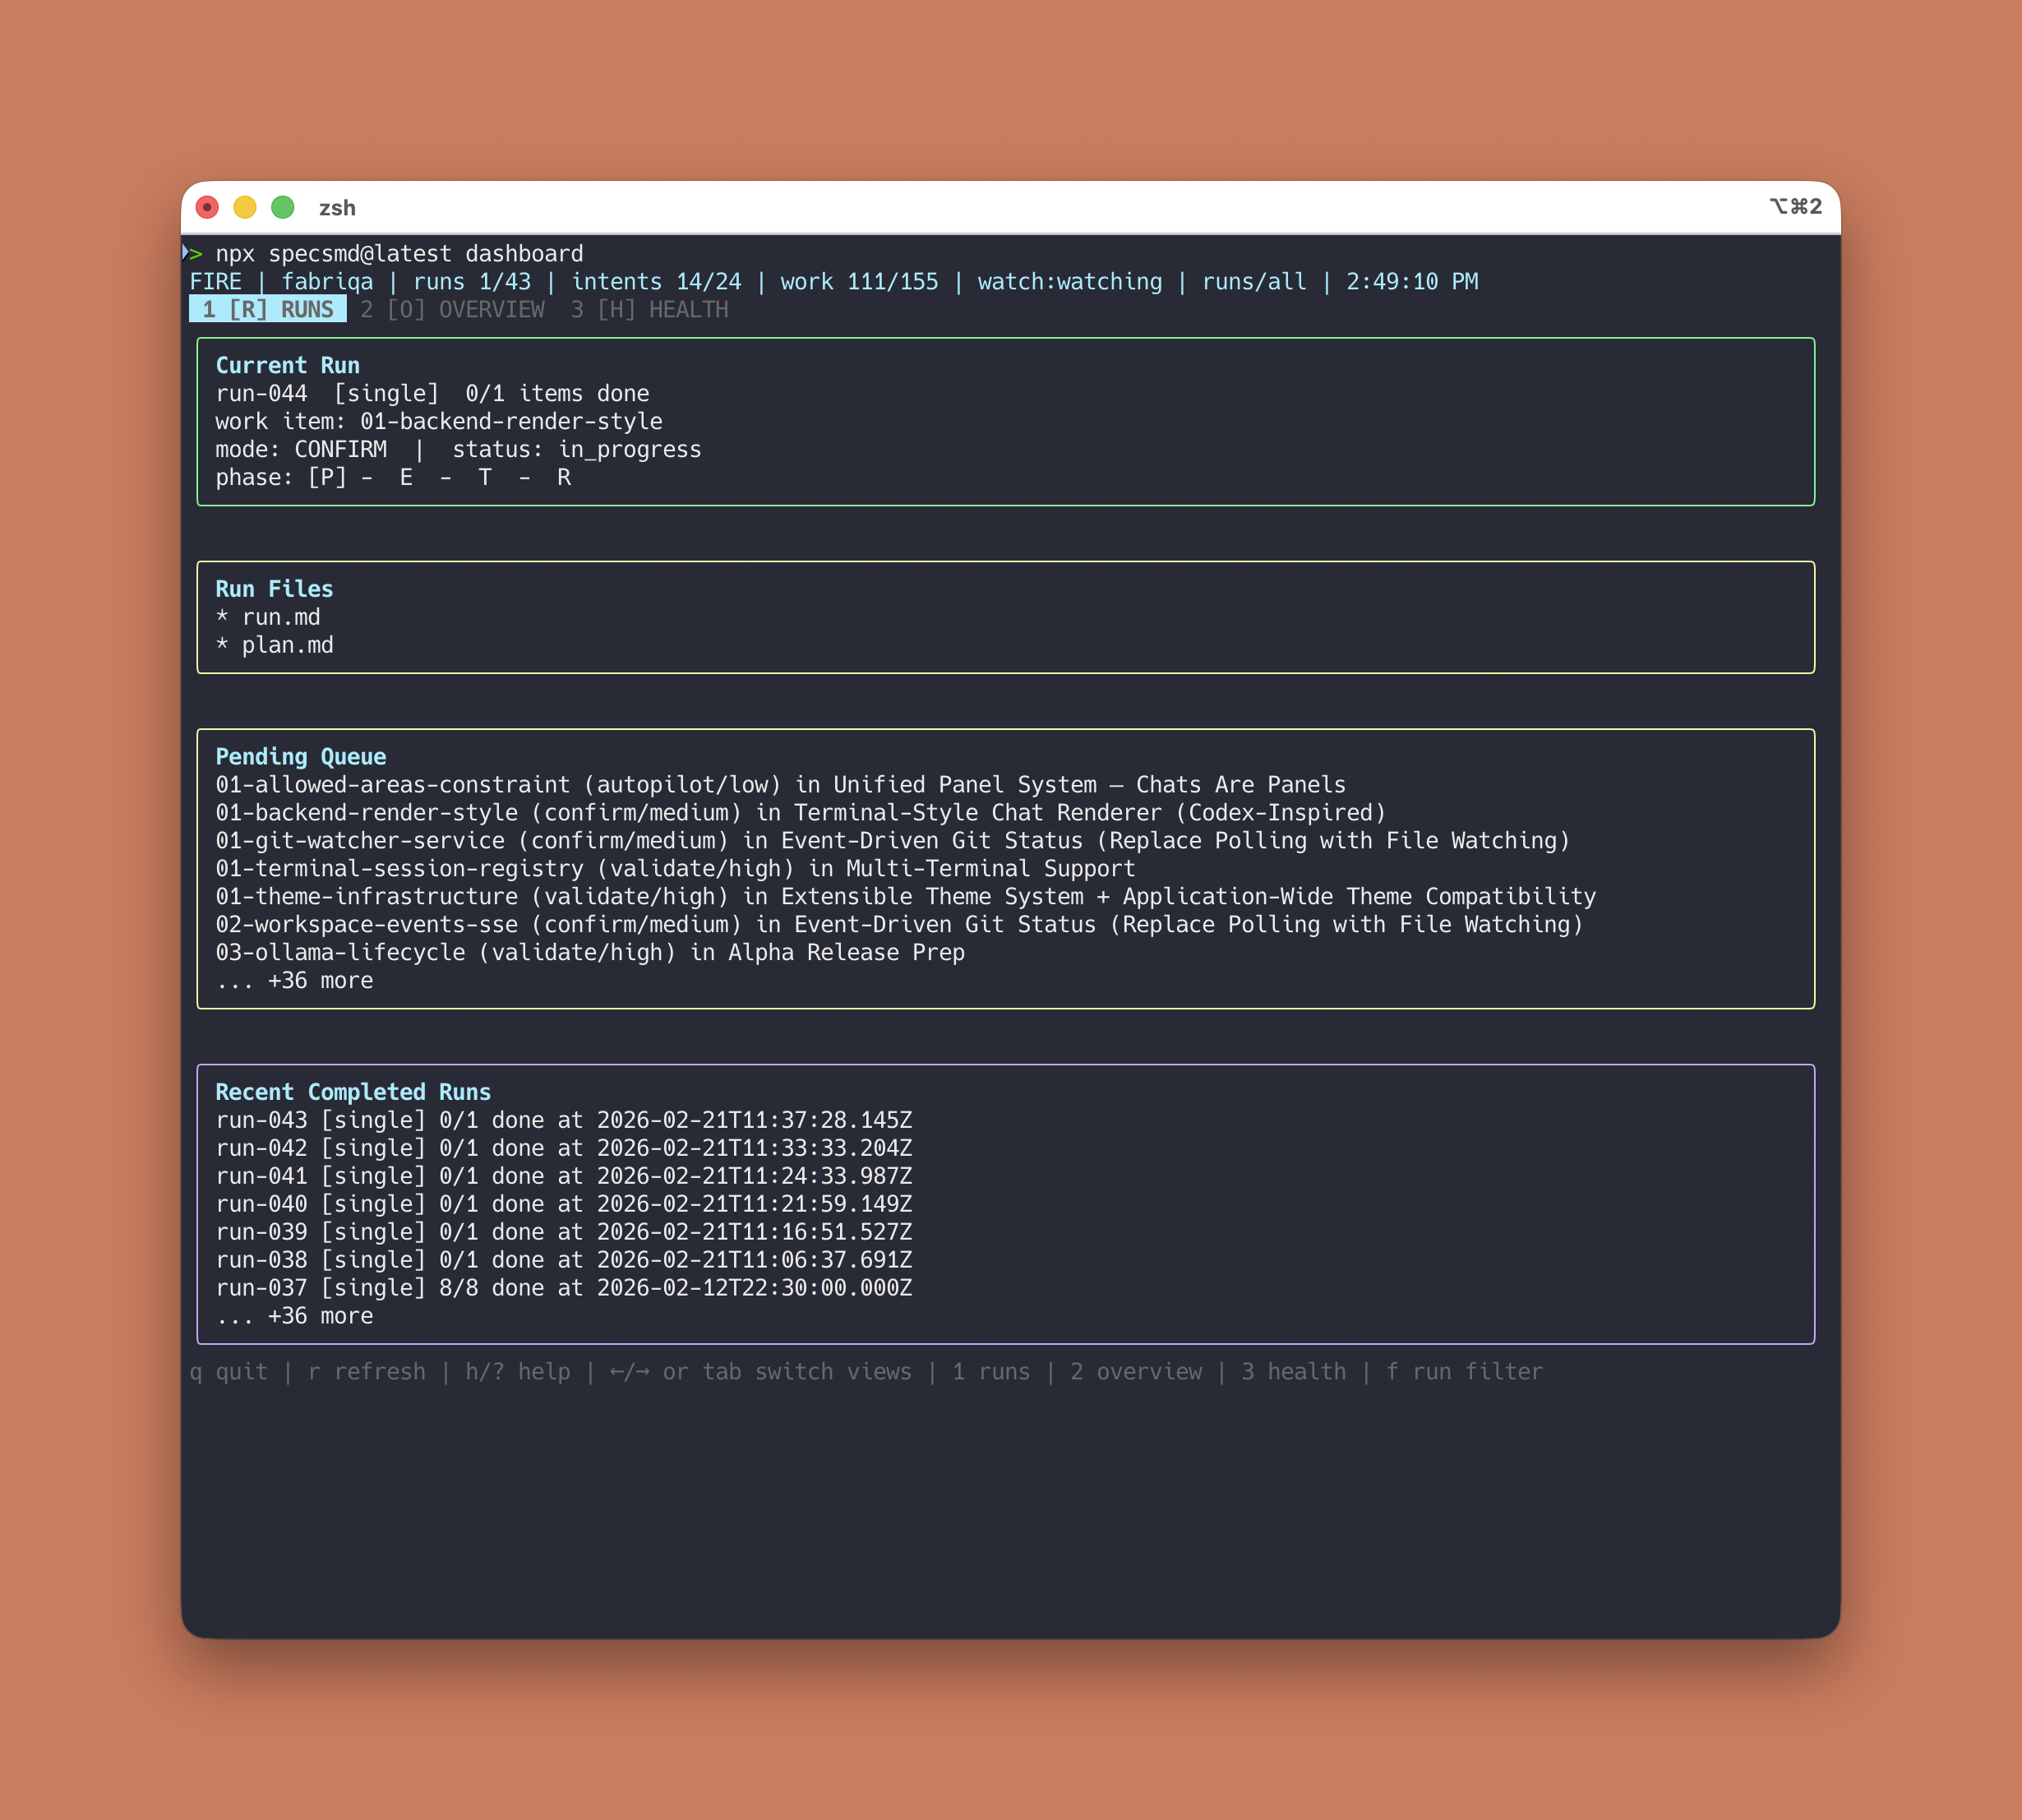
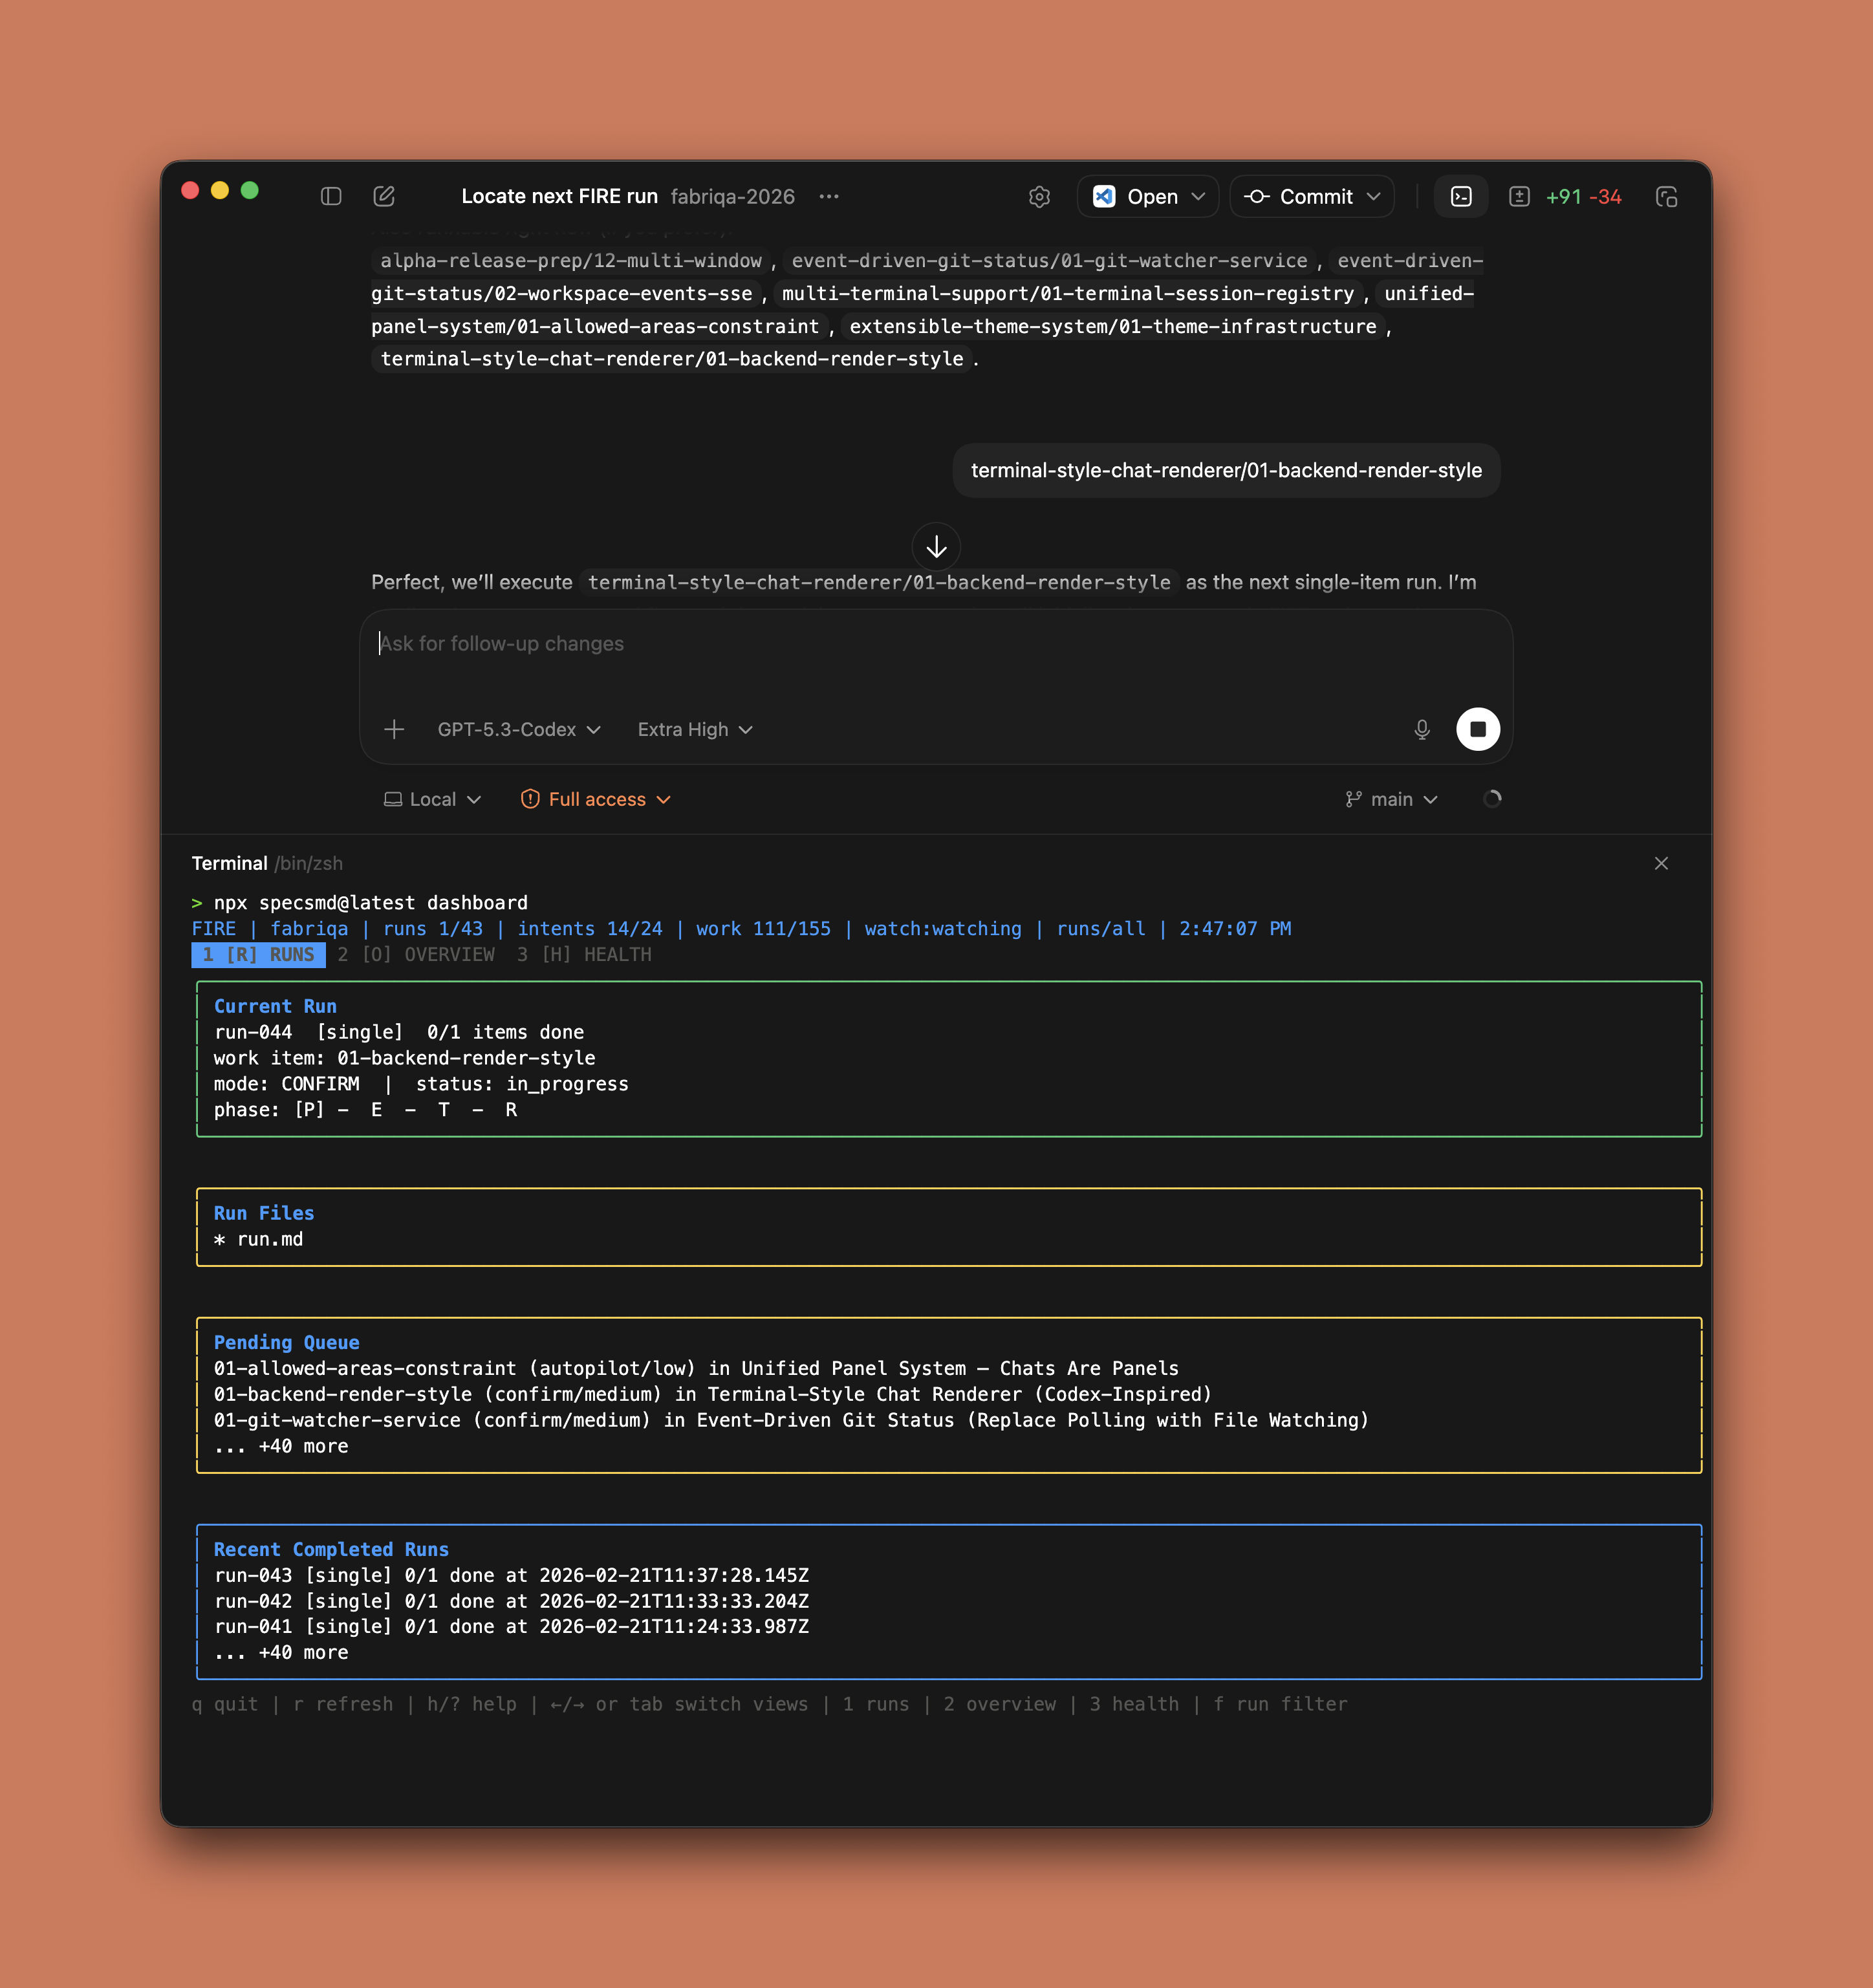
npx specsmd@latest dashboard-cliThe terminal dashboard auto-detects your flow and starts watching for changes. Press q to quit.
Terminal Dashboard Screenshots
Git Changes Tab (Commit Diff Preview)
Active Tab (File Preview Pane)
Terminal Tabs
The terminal dashboard has five tabs, switched with number keys 1–5:
Active Items (1)
Shows currently active runs (FIRE), bolts (AI-DLC), or specs (Simple) in the selected worktree. Includes a split preview pane for inspecting files and an “other worktrees” section showing activity across branches.
Intents (2)
Lists all intents in your project. Toggle between pending (n) and completed (x) intents.
Completed (3)
Historical view of finished runs, bolts, or specs with intent filtering.
Standards & Health (4)
Project standards files (constitution, tech-stack, coding-standards), progress stats, warnings, and error details.
Git Changes (5)
Git status with staged, unstaged, untracked, and conflicted files. Select a file to preview its diff in the split pane. Shows branch tracking info with ahead/behind counts.
Terminal Keyboard Shortcuts
Global
| Key | Action |
|---|---|
1–5 |
Switch tab |
r |
Refresh |
h / ? |
Toggle help overlay |
] / m |
Switch flow (when multiple detected) |
[ |
Switch flow backward |
g / G |
Next / previous section |
q / Ctrl+C |
Quit |
Navigation & Preview
| Key | Action |
|---|---|
↑ ↓ / j k |
Navigate rows |
Enter |
Expand / collapse folder |
v / Space |
Preview file in split pane |
v v |
Fullscreen preview |
Tab |
Switch focus between main and preview |
o |
Open file in default app |
Esc |
Close overlay / preview |
Section Focus
| Key | Tab | Jumps to |
|---|---|---|
a |
1 | Active item |
f |
1 | Files |
b |
1 | Worktree switcher |
u |
1 | Other worktrees |
i |
2 | Intents |
n / x |
2 | Next / completed toggle |
c |
3 | Completed |
s |
4 | Standards |
t |
4 | Stats |
w |
4 | Warnings |
e |
4 | Errors |
d |
5 | Git diff |
Terminal Git Worktree Support
The terminal dashboard auto-discovers git worktrees and shows activity across branches.
- Worktree switcher — press
bon the Active tab to switch between worktrees - Cross-worktree view — the “Other worktrees” section shows active runs/bolts in other branches
- Auto-selection — picks the current worktree by default, falling back to main
Terminal Dashboard Options
npx specsmd@latest dashboard-cli [options]| Option | Default | Description |
|---|---|---|
--flow <flow> |
auto-detect | Flow to inspect: fire, aidlc, or simple |
--path <dir> |
current directory | Workspace path |
--worktree <name> |
auto-select | Initial worktree (branch name, id, or path) |
--refresh-ms <n> |
1000 |
File watch interval in ms (200–5000) |
--no-watch |
false |
Render once and exit (non-interactive) |
Terminal Examples
# Terminal UI
npx specsmd@latest dashboard-cli

# Specific terminal flow
npx specsmd@latest dashboard-cli --flow fire

# Start on a feature branch worktree
npx specsmd@latest dashboard-cli --worktree feature-auth

# One-time snapshot (CI/non-TTY)
npx specsmd@latest dashboard-cli --no-watch
Icon Sets
Configure icons via the SPECSMD_ICON_SET environment variable:
| Value | Style |
|---|---|
ascii |
Plain ASCII characters (default) |
unicode |
Unicode symbols |
nerd |
Nerd Font icons (requires a Nerd Font) |
SPECSMD_ICON_SET=nerd npx specsmd@latest dashboard-cliVideo Tutorials
Watch both dashboard modes in action: the web dashboard from Chrome/Fabriqa.AI, and the terminal dashboard alongside Codex Desktop App.
CLI and Web Dashboard Tutorials
Learn the browser dashboard and the terminal dashboard workflows